I got something on my mind grapes I need to talk to you about.
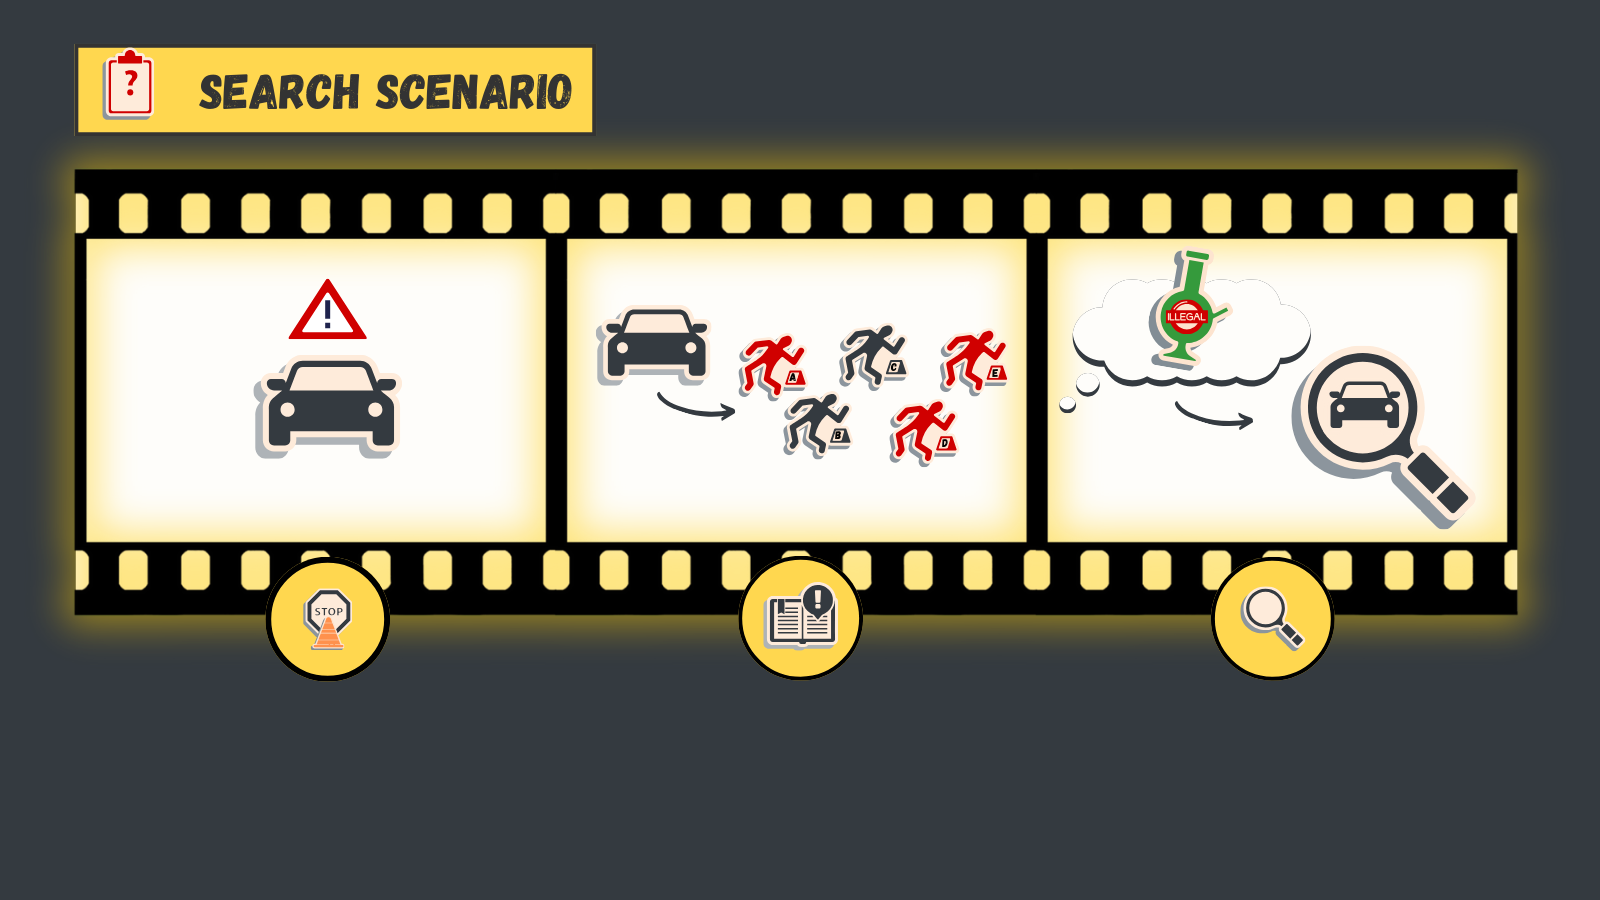
Using juxtapose to visually demonstrate the sense-making process of hindsight bias.
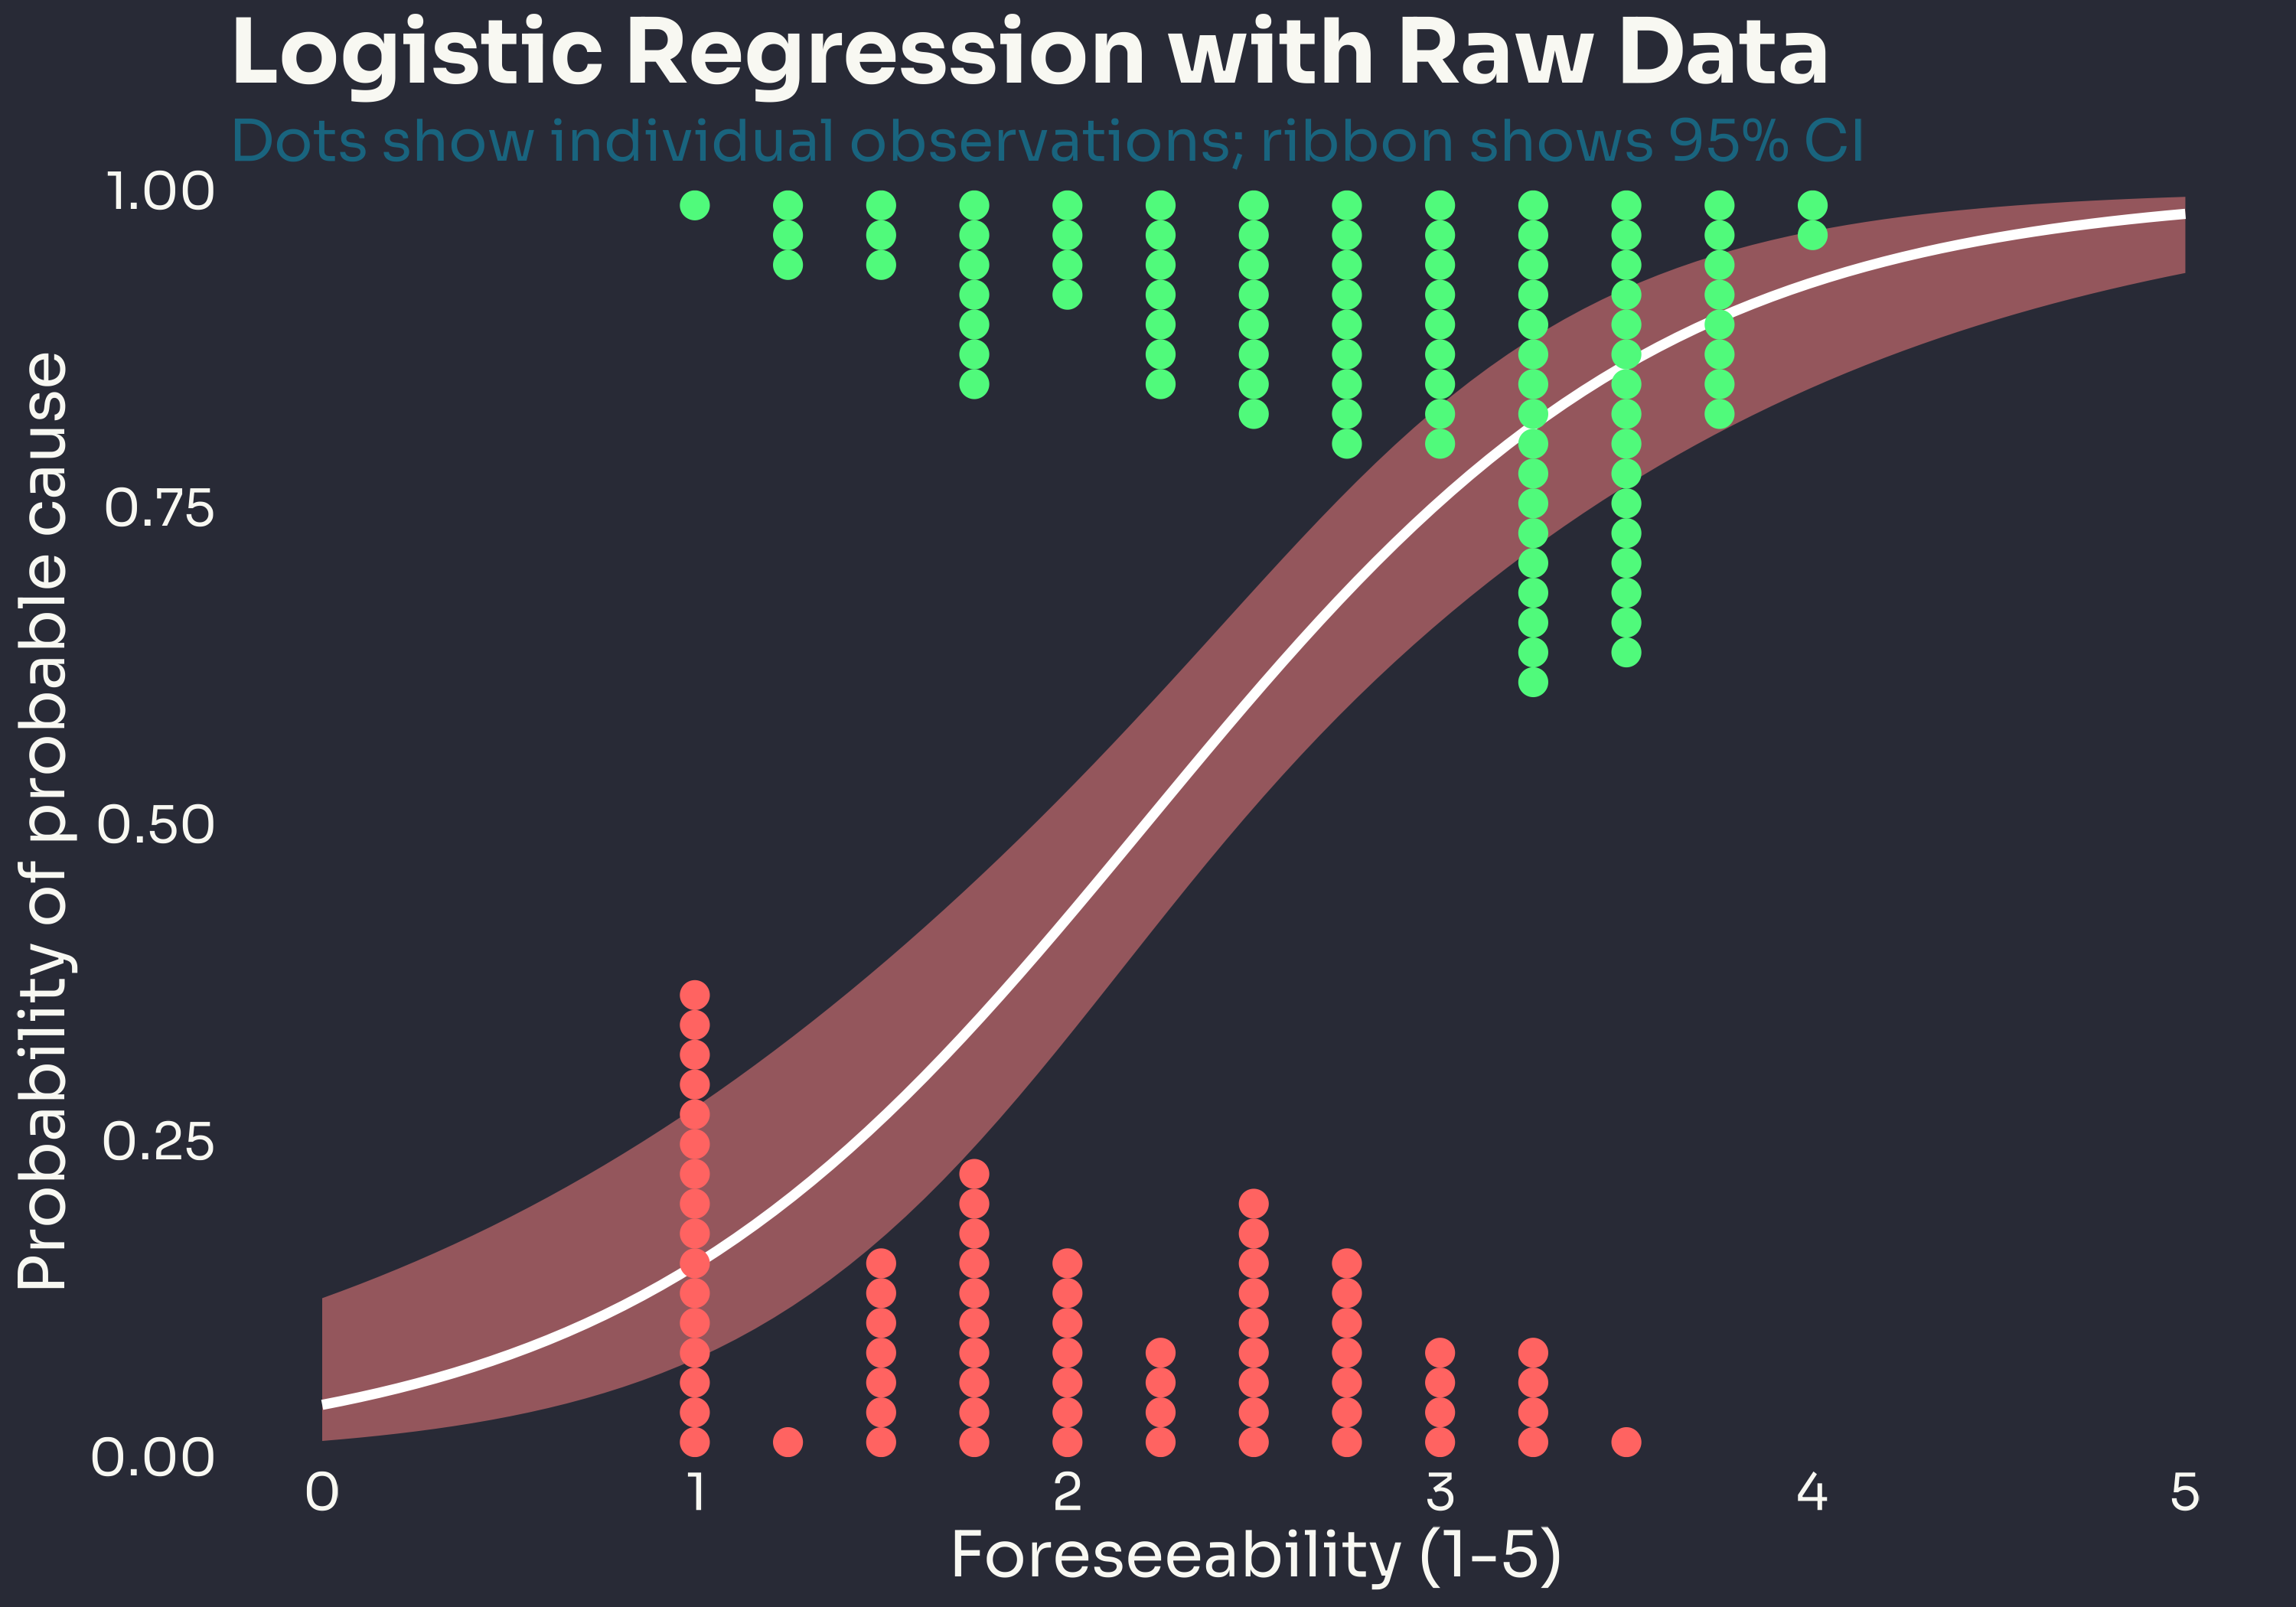
This is an attempt to create logistic regression plots that don’t suck to look at. Using data from APLS 2024.
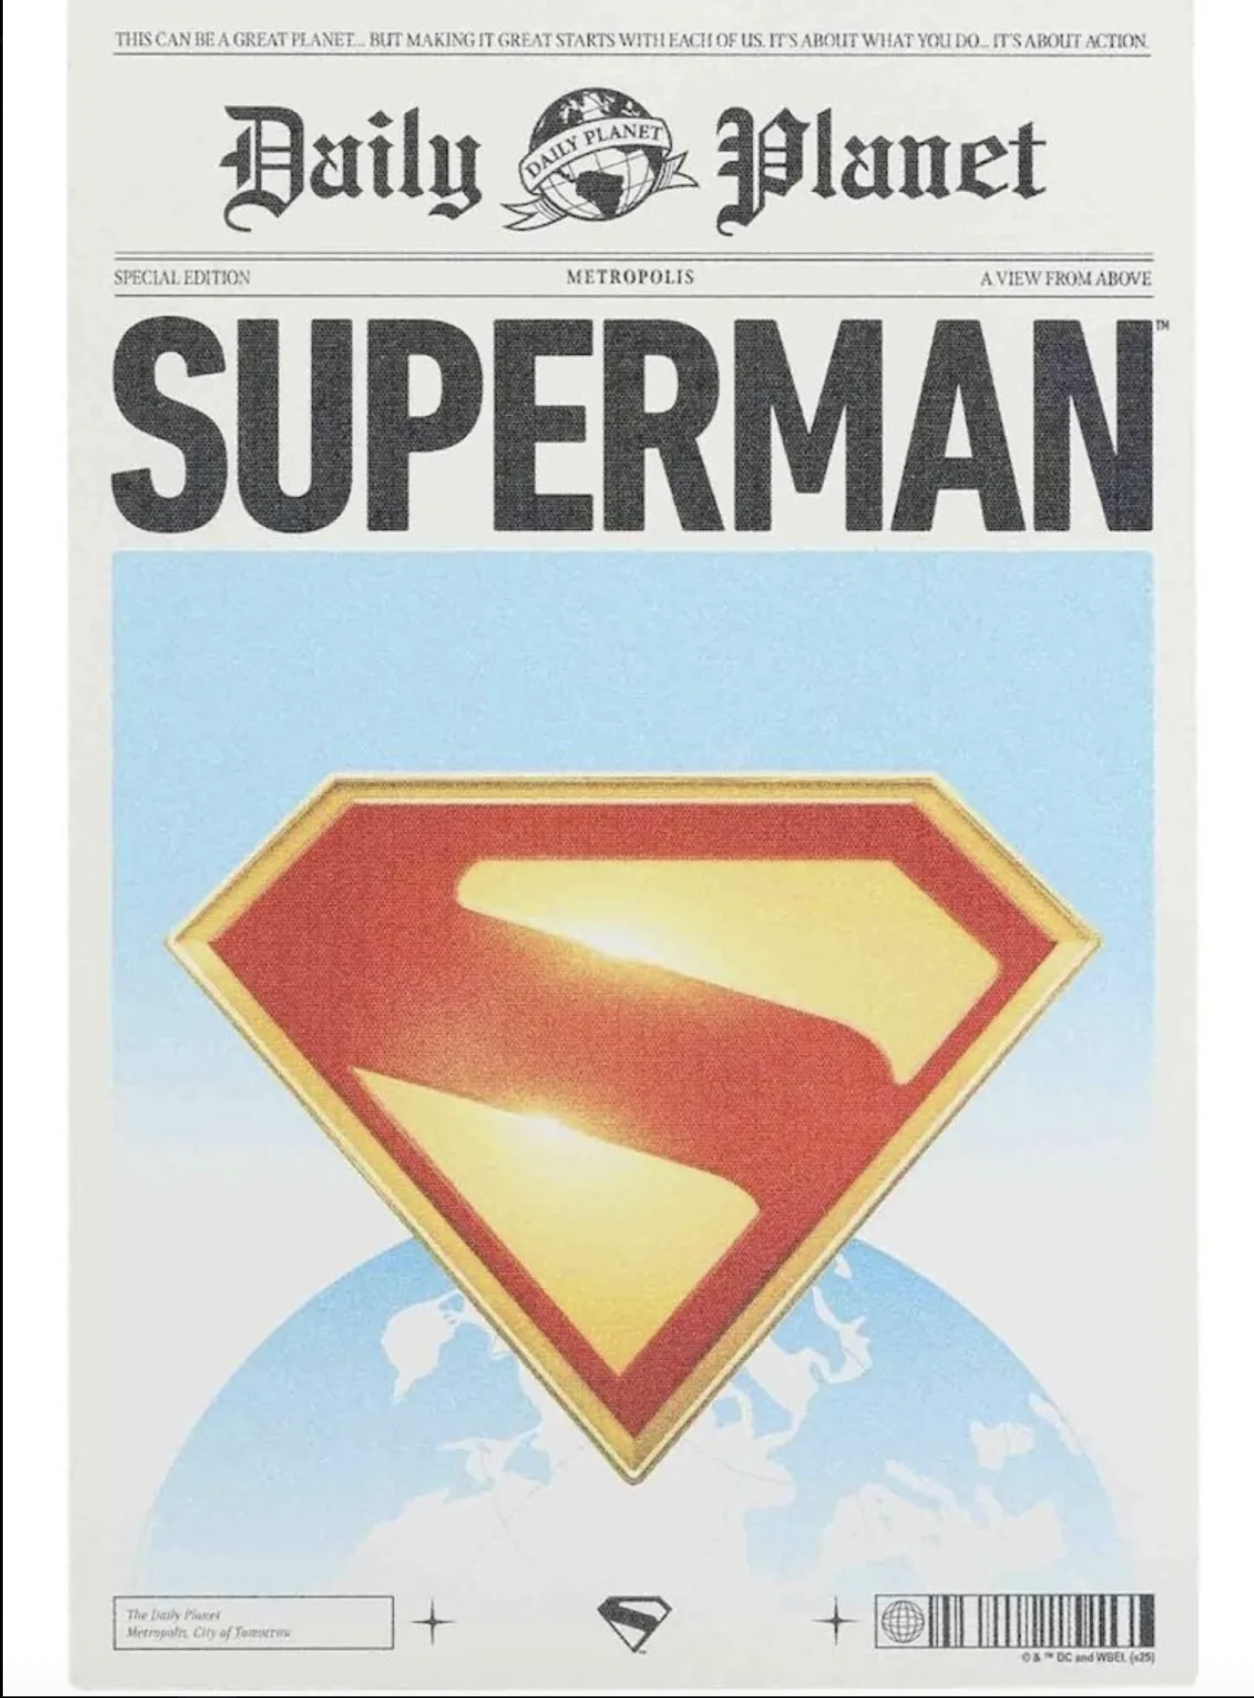
Scraping and combining data from Rotten Tomatoes, Letterboxd, and Box Office Mojo to analyze Superman movies and TV shows.
This is a test post. In this post, I try out different things that might look good (or not so good)
Figuring out how to make fancy electoral maps in r and then documenting it so I don’t have to keep looking it up!
Making bar charts with data from the most popular Court Review articles.
Testing whether this type of thing will work for creating interactive vignettes.
How to make a waffle chart with images so that I don’t keep having to look it up!!
A brief explanation of why we made a new ap-ls.org and how it can help AP-LS provide more dynamic content to its membership.
Efforts towards creating a presidential archive table for the new AP-LS website in a way that makes updating it easy.