# load packages
library(sf)
library(tigris)
library(ggplot2)
library(dplyr)
library(ggfx)
library(ggtext)Recently ran into a few situations where I needed to make some data-driven maps that reflected either congressional districts or census data or some combination of the two. Here are my notes and
Creating Congressional District Maps with ggplot2
For a project examining the Electoral College and voting behavior, we needed to make visually appealing maps of congressional districts. Our study focused on on four states: Maine, New Hampshire, Nebraska, and Kansas. Two of these states allocate their EC votes by congressional district (Nebraska & Maine) and the other two are winner-take-all states of comparable size/politics (Kansas & New Hampshire respectively). But this process could be used to create similar maps for any state in the U.S.
Setting Up Your Environment
First, let’s load the necessary libraries:
Each package served a different purpose in the making of our maps:
sf: Handles spatial datatigris: Accesses U.S. Census Bureau geographic dataggplot2: Creates our visualizationsdplyr: Manipulates dataggfx: Adds visual effectsggtext: Enhances text rendering
In order to get the district-level map shape, we need to set some options for the tigris package:
options(tigris_class = "sf", tigris_use_cache = TRUE)This ensures we’re using simple features (sf) class and caching data to speed up future runs.
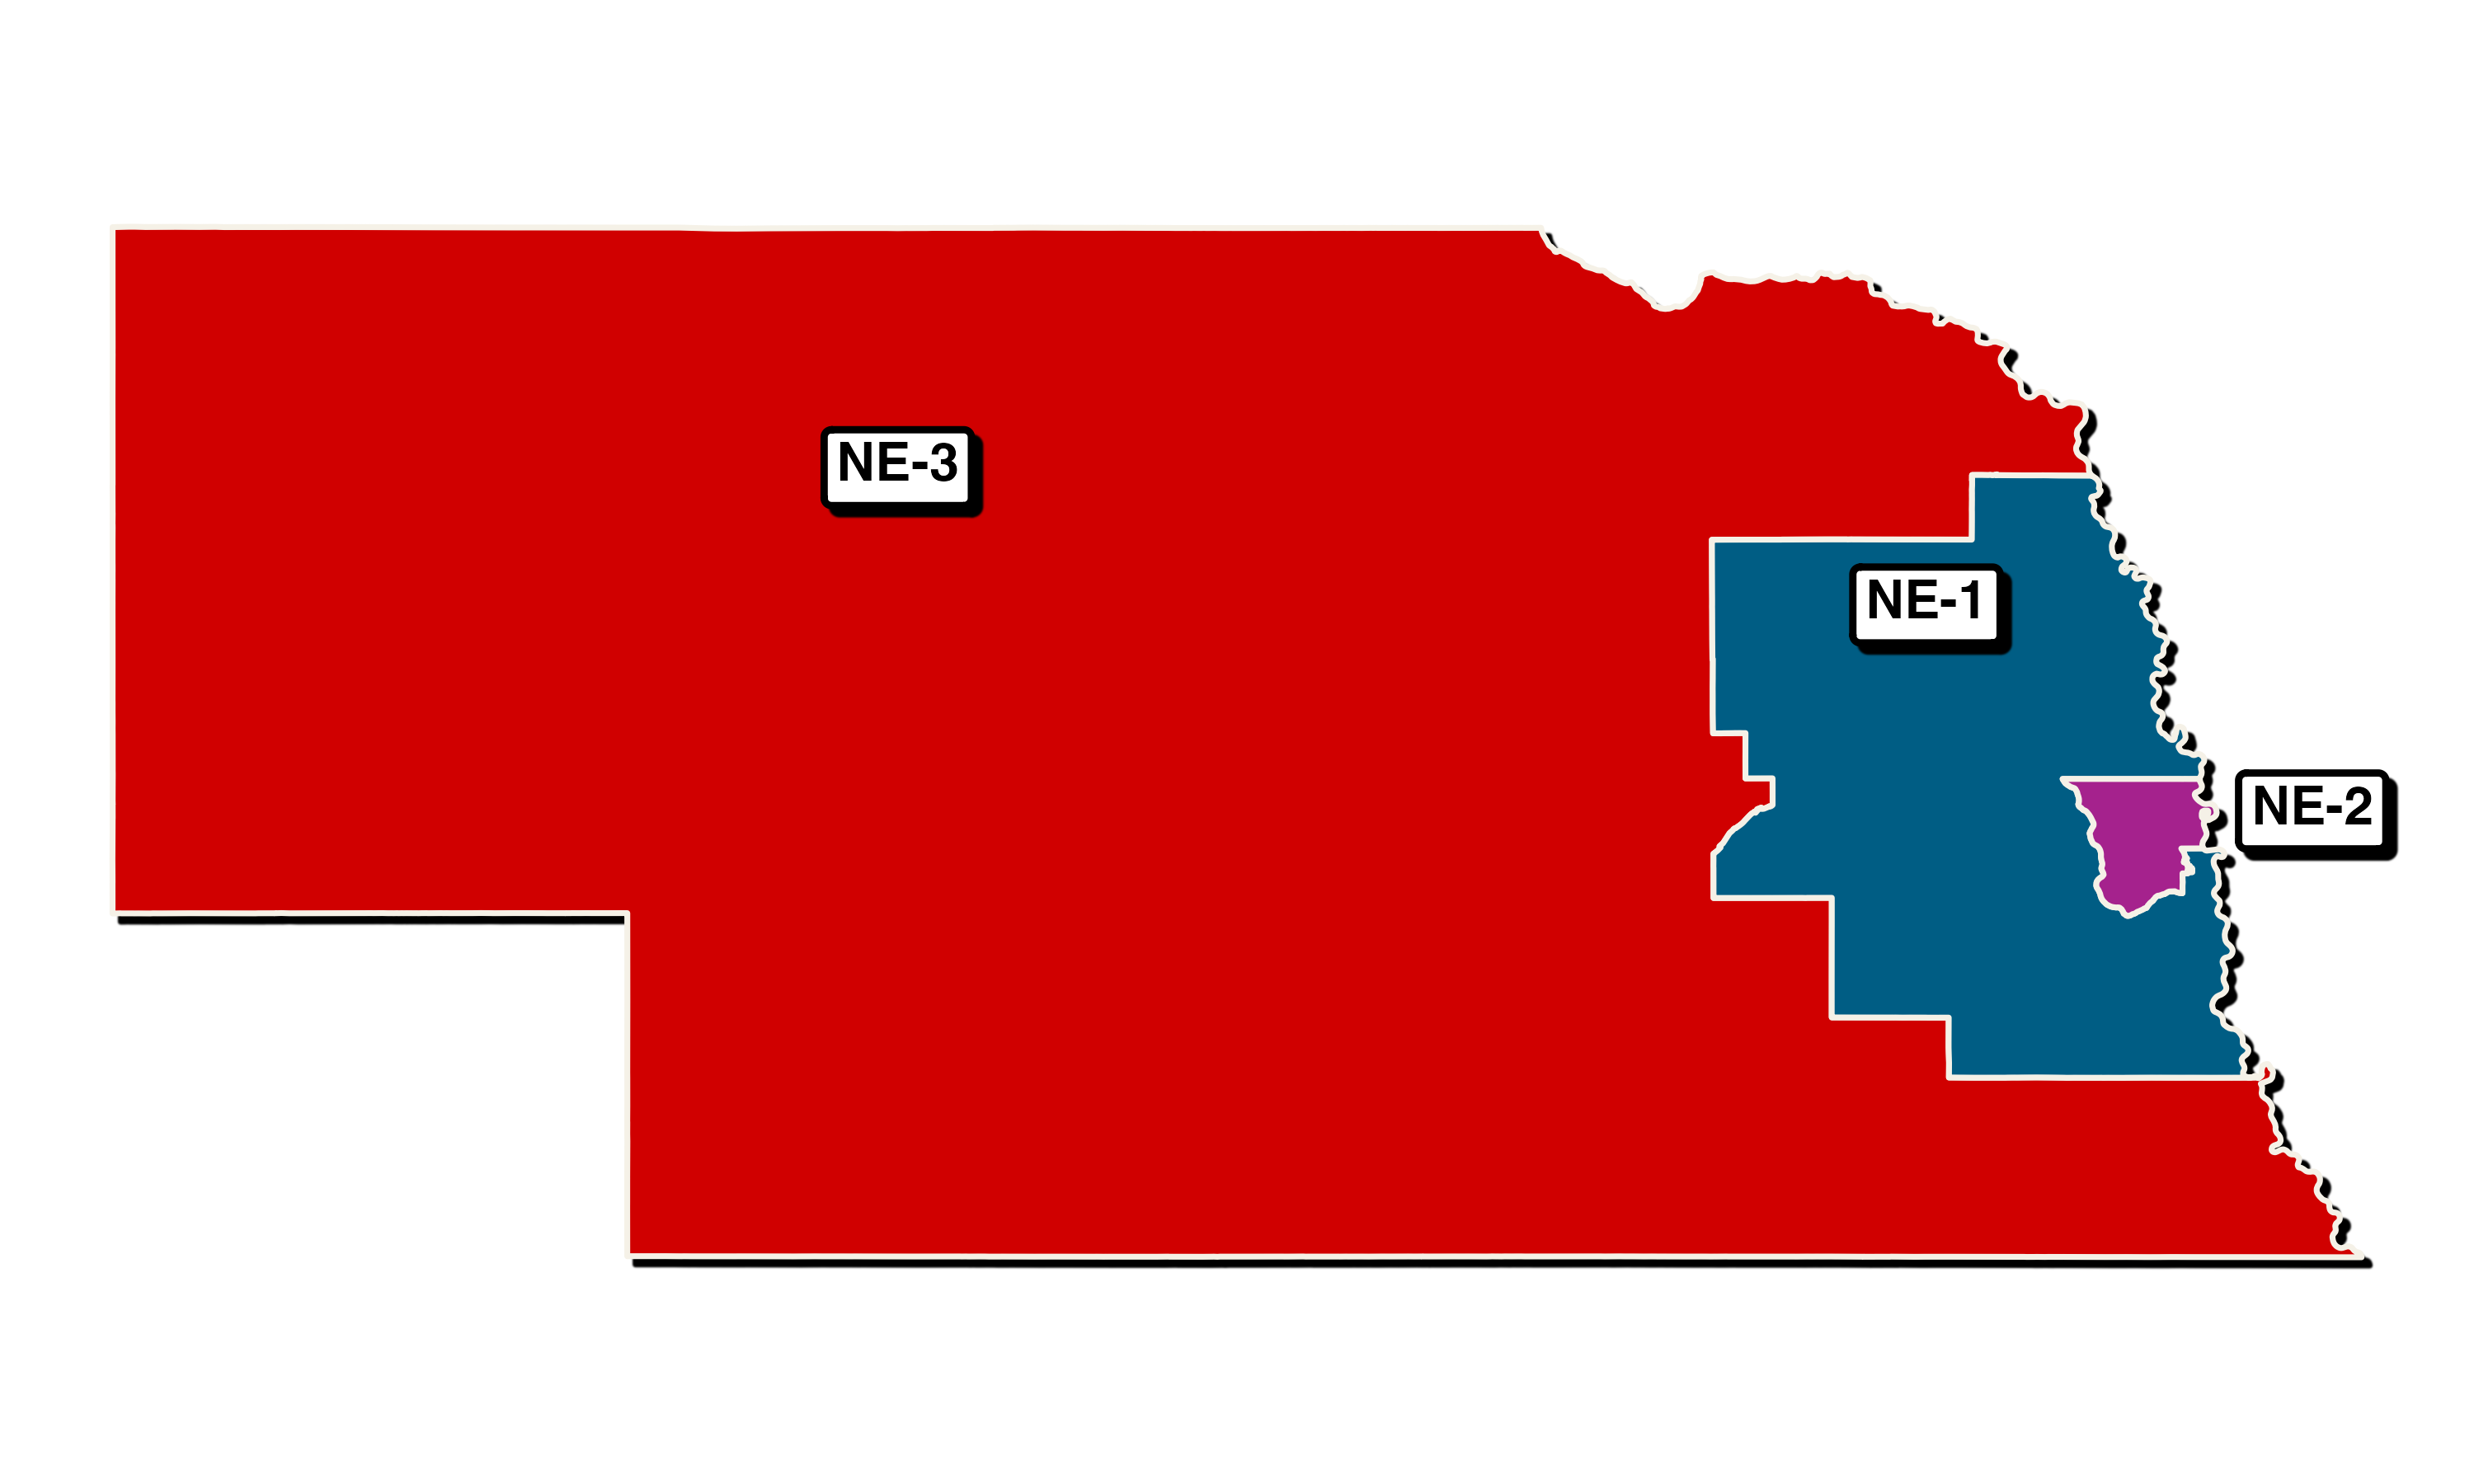
Creating a Map: Nebraska as an Example
Let’s walk through the process of creating the Nebraska congressional district map:
Coordinates
Download the shape-file for each congressional district data using tigris::congressional_districts()
neb_districts <- tigris::congressional_districts(state = "NE", cb = TRUE, year = 2020)You can also ask for the unique GEOID values for each district. This is needed to set the colors for the district.
print(unique(neb_districts$GEOID))- Create the basic Nebraska map using
ggplot2. We will want to includetheme_void()to just get the map with not plot-background/axis/etc. We also want to use the GEOID information to set the colors usingscale_fill_manual().
p <- ggplot(neb_districts) +
  geom_sf(aes(fill = as.factor(GEOID)), color = "#f5f1e7", lwd = 2) +
  theme_void() +
  scale_fill_manual(values = c("3103" = "#E81B23", "3101" = "#00AEF3", "3102" = "#a5228d"))

print(p)
We used the hex codes for the Republican #E81B23 and Democrat #00AEF3 parties. Also, purple #a5228d because NE-2 has operated as a swing-district over the last few Presidential elections.
Create a dataframe for district labels:
ne_label <- tibble(
  txt = c("**NE-1**", "**NE-2**", "**NE-3**"),
  lon = c(-97, -95.5, -101),
  lat = c(41.9, 41.3, 42.3)
)- Create the plot using ggplot2:
p1 <- ggplot(neb_districts) +
  with_shadow(geom_sf(aes(fill = as.factor(GEOID)), color = "#f5f1e7", lwd = 2)) +
  theme_void() +
  scale_fill_manual(values = c("3103" = "#E81B23", "3101" = "#00AEF3", "3102" = "#a5228d")) +
  with_shadow(geom_richtext(
    data = ne_label,
    aes(x = lon, y = lat, label = txt),
    size = 5.5,
    label.size = 1
  )) +
  theme(legend.position = "none")

print(p1)
Let’s break down this code:
ggplot(neb_districts): Initializes the plot with our district datawith_shadow(geom_sf(...)): Draws the district boundaries with a shadow effecttheme_void(): Removes the default background gridscale_fill_manual(): Sets custom colors for each districtwith_shadow(geom_richtext(...)): Adds district labels with a shadow effecttheme(legend.position = "none"): Removes the legend
- Save the plot:
ggsave("nebraska_districts.png", width = 10, height = 6, units = "in")Repeating for Other States
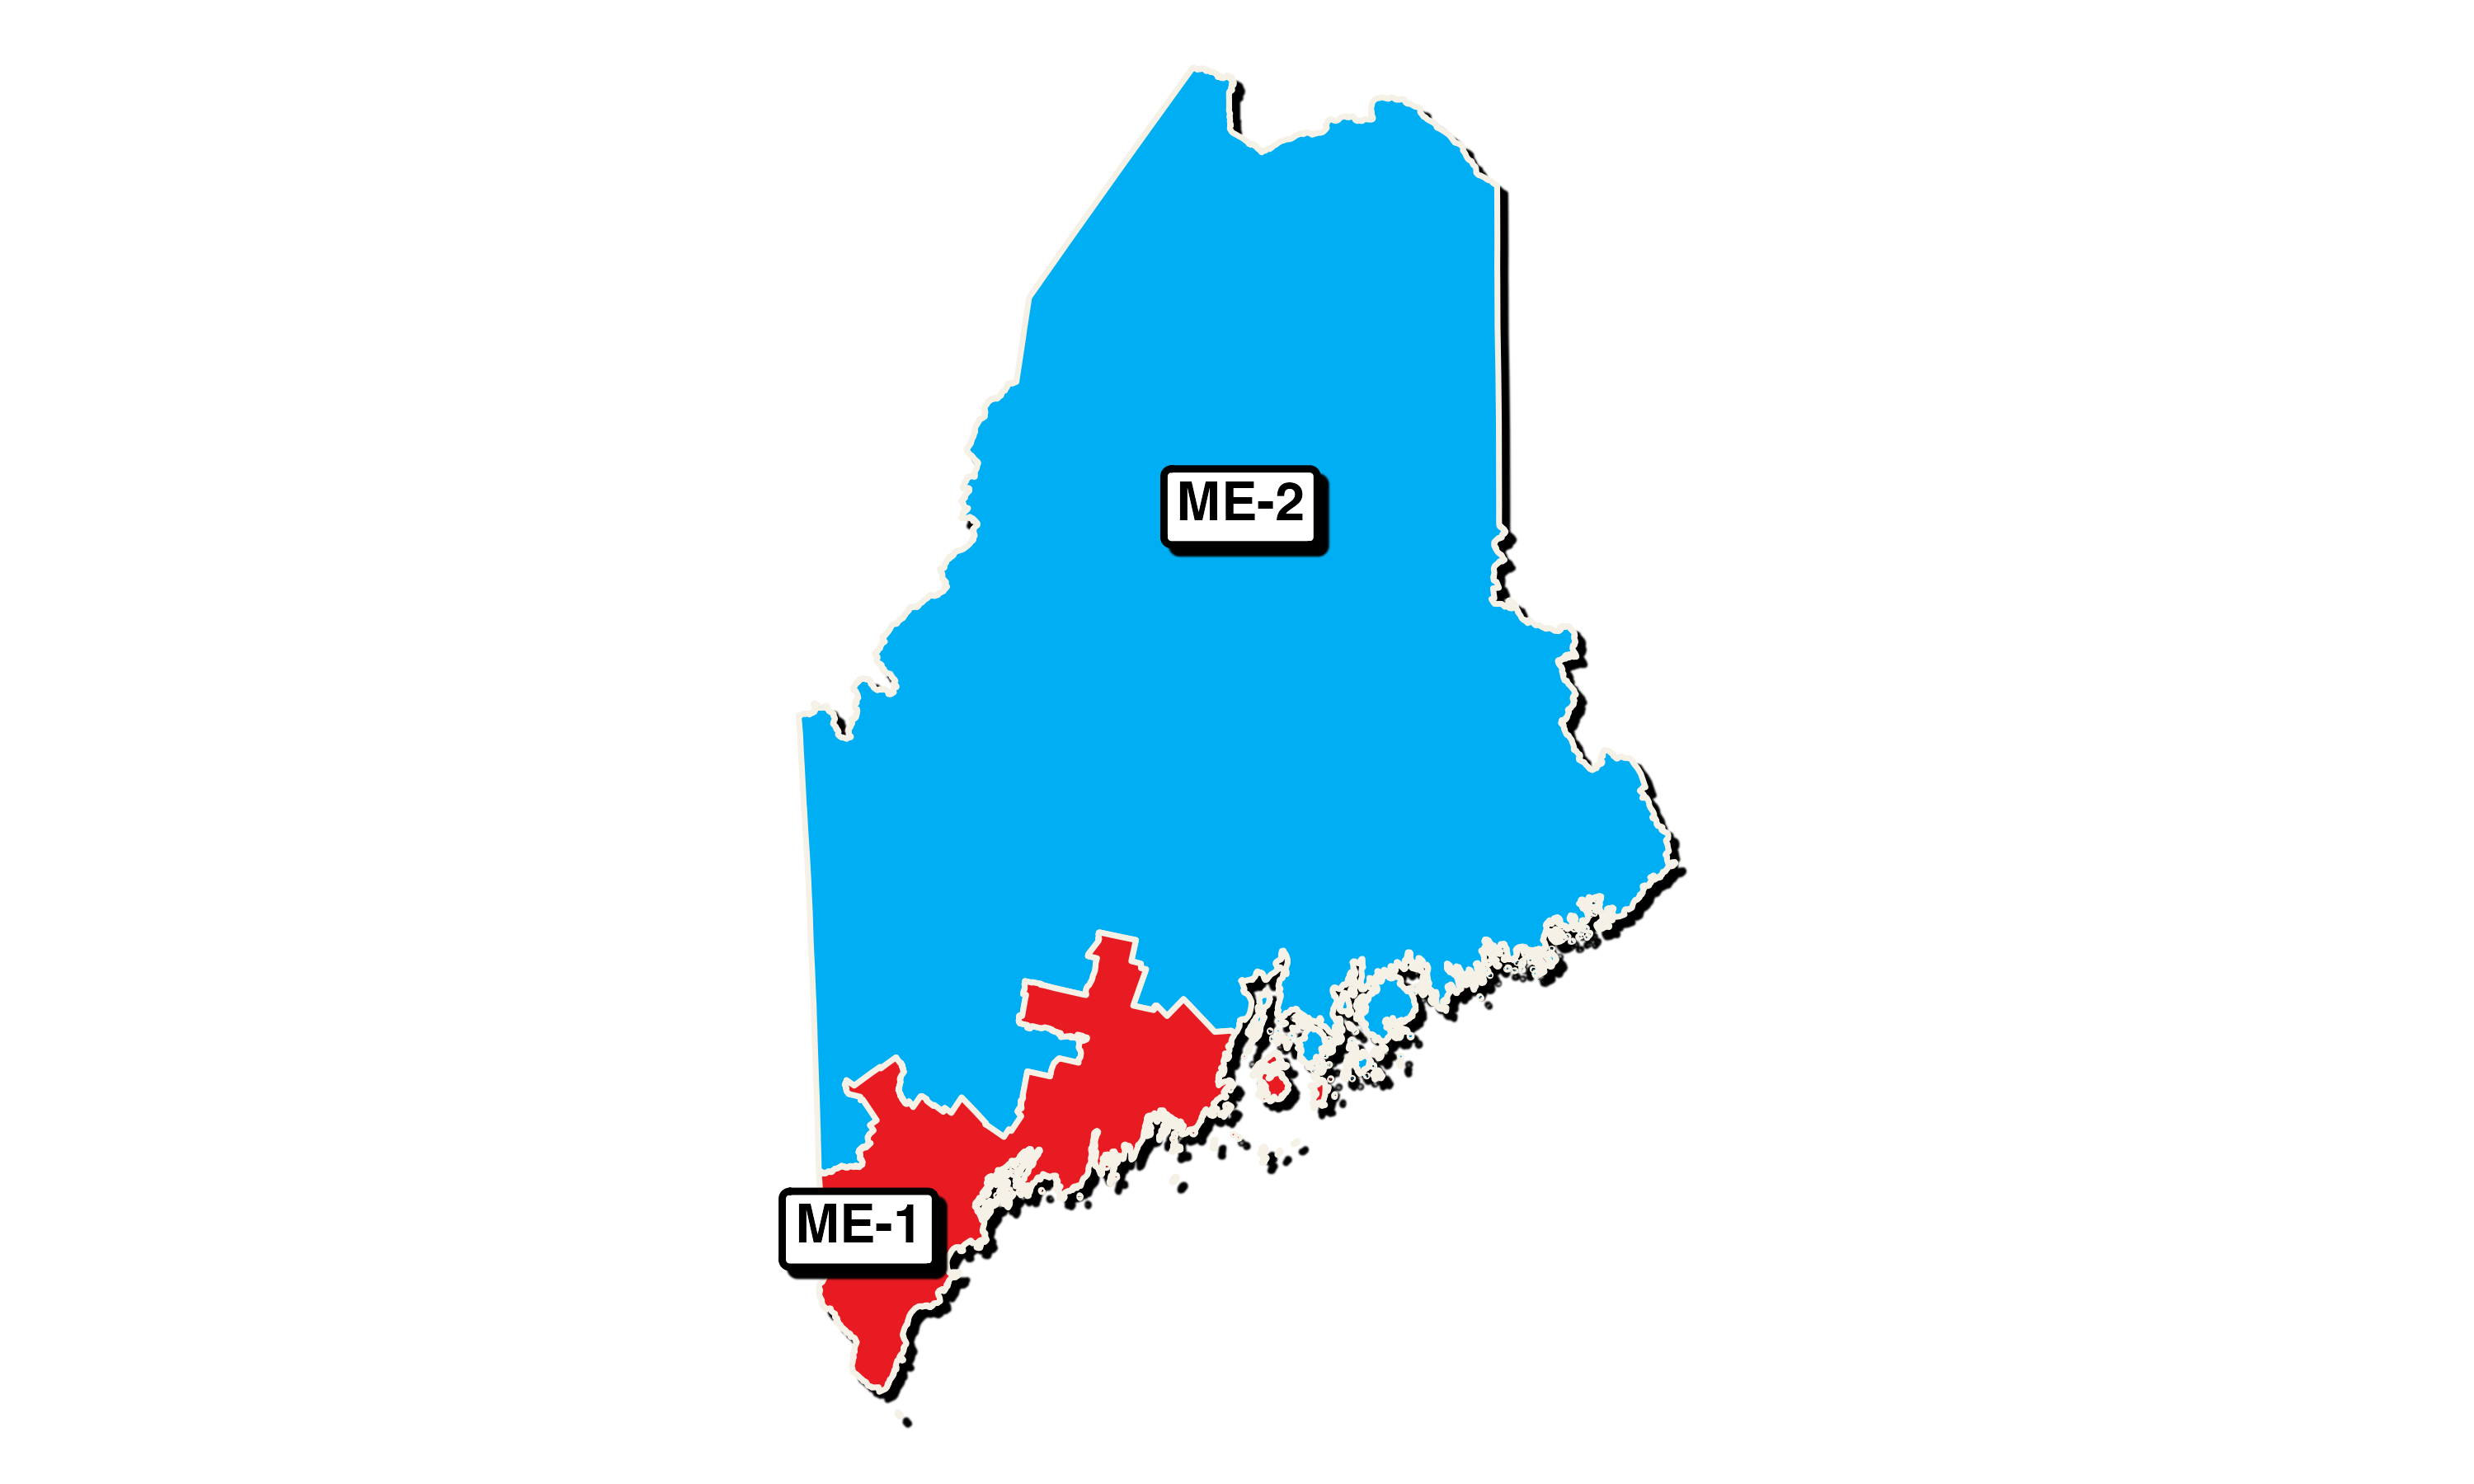
The process is similar for other states. Here’s how you’d create the Maine map:
- Download data and create labels:
maine_districts <- tigris::congressional_districts(state = "ME", cb = TRUE, year = 2020)

me_label <- tibble(
  txt = c("**ME-1**", "**ME-2**"),
  lon = c(-70.8, -69),
  lat = c(43.6, 46)
)- Create the plot:
p3 <- ggplot(maine_districts) +
  with_shadow(geom_sf(aes(fill = as.factor(GEOID)), color = "#f5f1e7", lwd = 0.8)) +
  theme_void() +
  scale_fill_manual(values = c("2301" = "#E81B23", "2302" = "#00AEF3")) +
  with_shadow(geom_richtext(
    data = me_label,
    aes(x = lon, y = lat, label = txt),
    size = 5.5,
    label.size = 1
  )) +
  theme(legend.position = "none")

print(p3)- Display and save:
ggsave("maine_districts.png", width = 10, height = 6, units = "in")Customization Tips
- Colors: Adjust the
scale_fill_manual()function to change district colors. - Labels: Modify the
txt,lon, andlatvalues in the label tibble to reposition or rename labels. - Shadows: The
with_shadow()function adds depth. Remove it for a flatter look. - Boundaries: Change the
colorandlwdparameters ingeom_sf()to adjust boundary appearance.
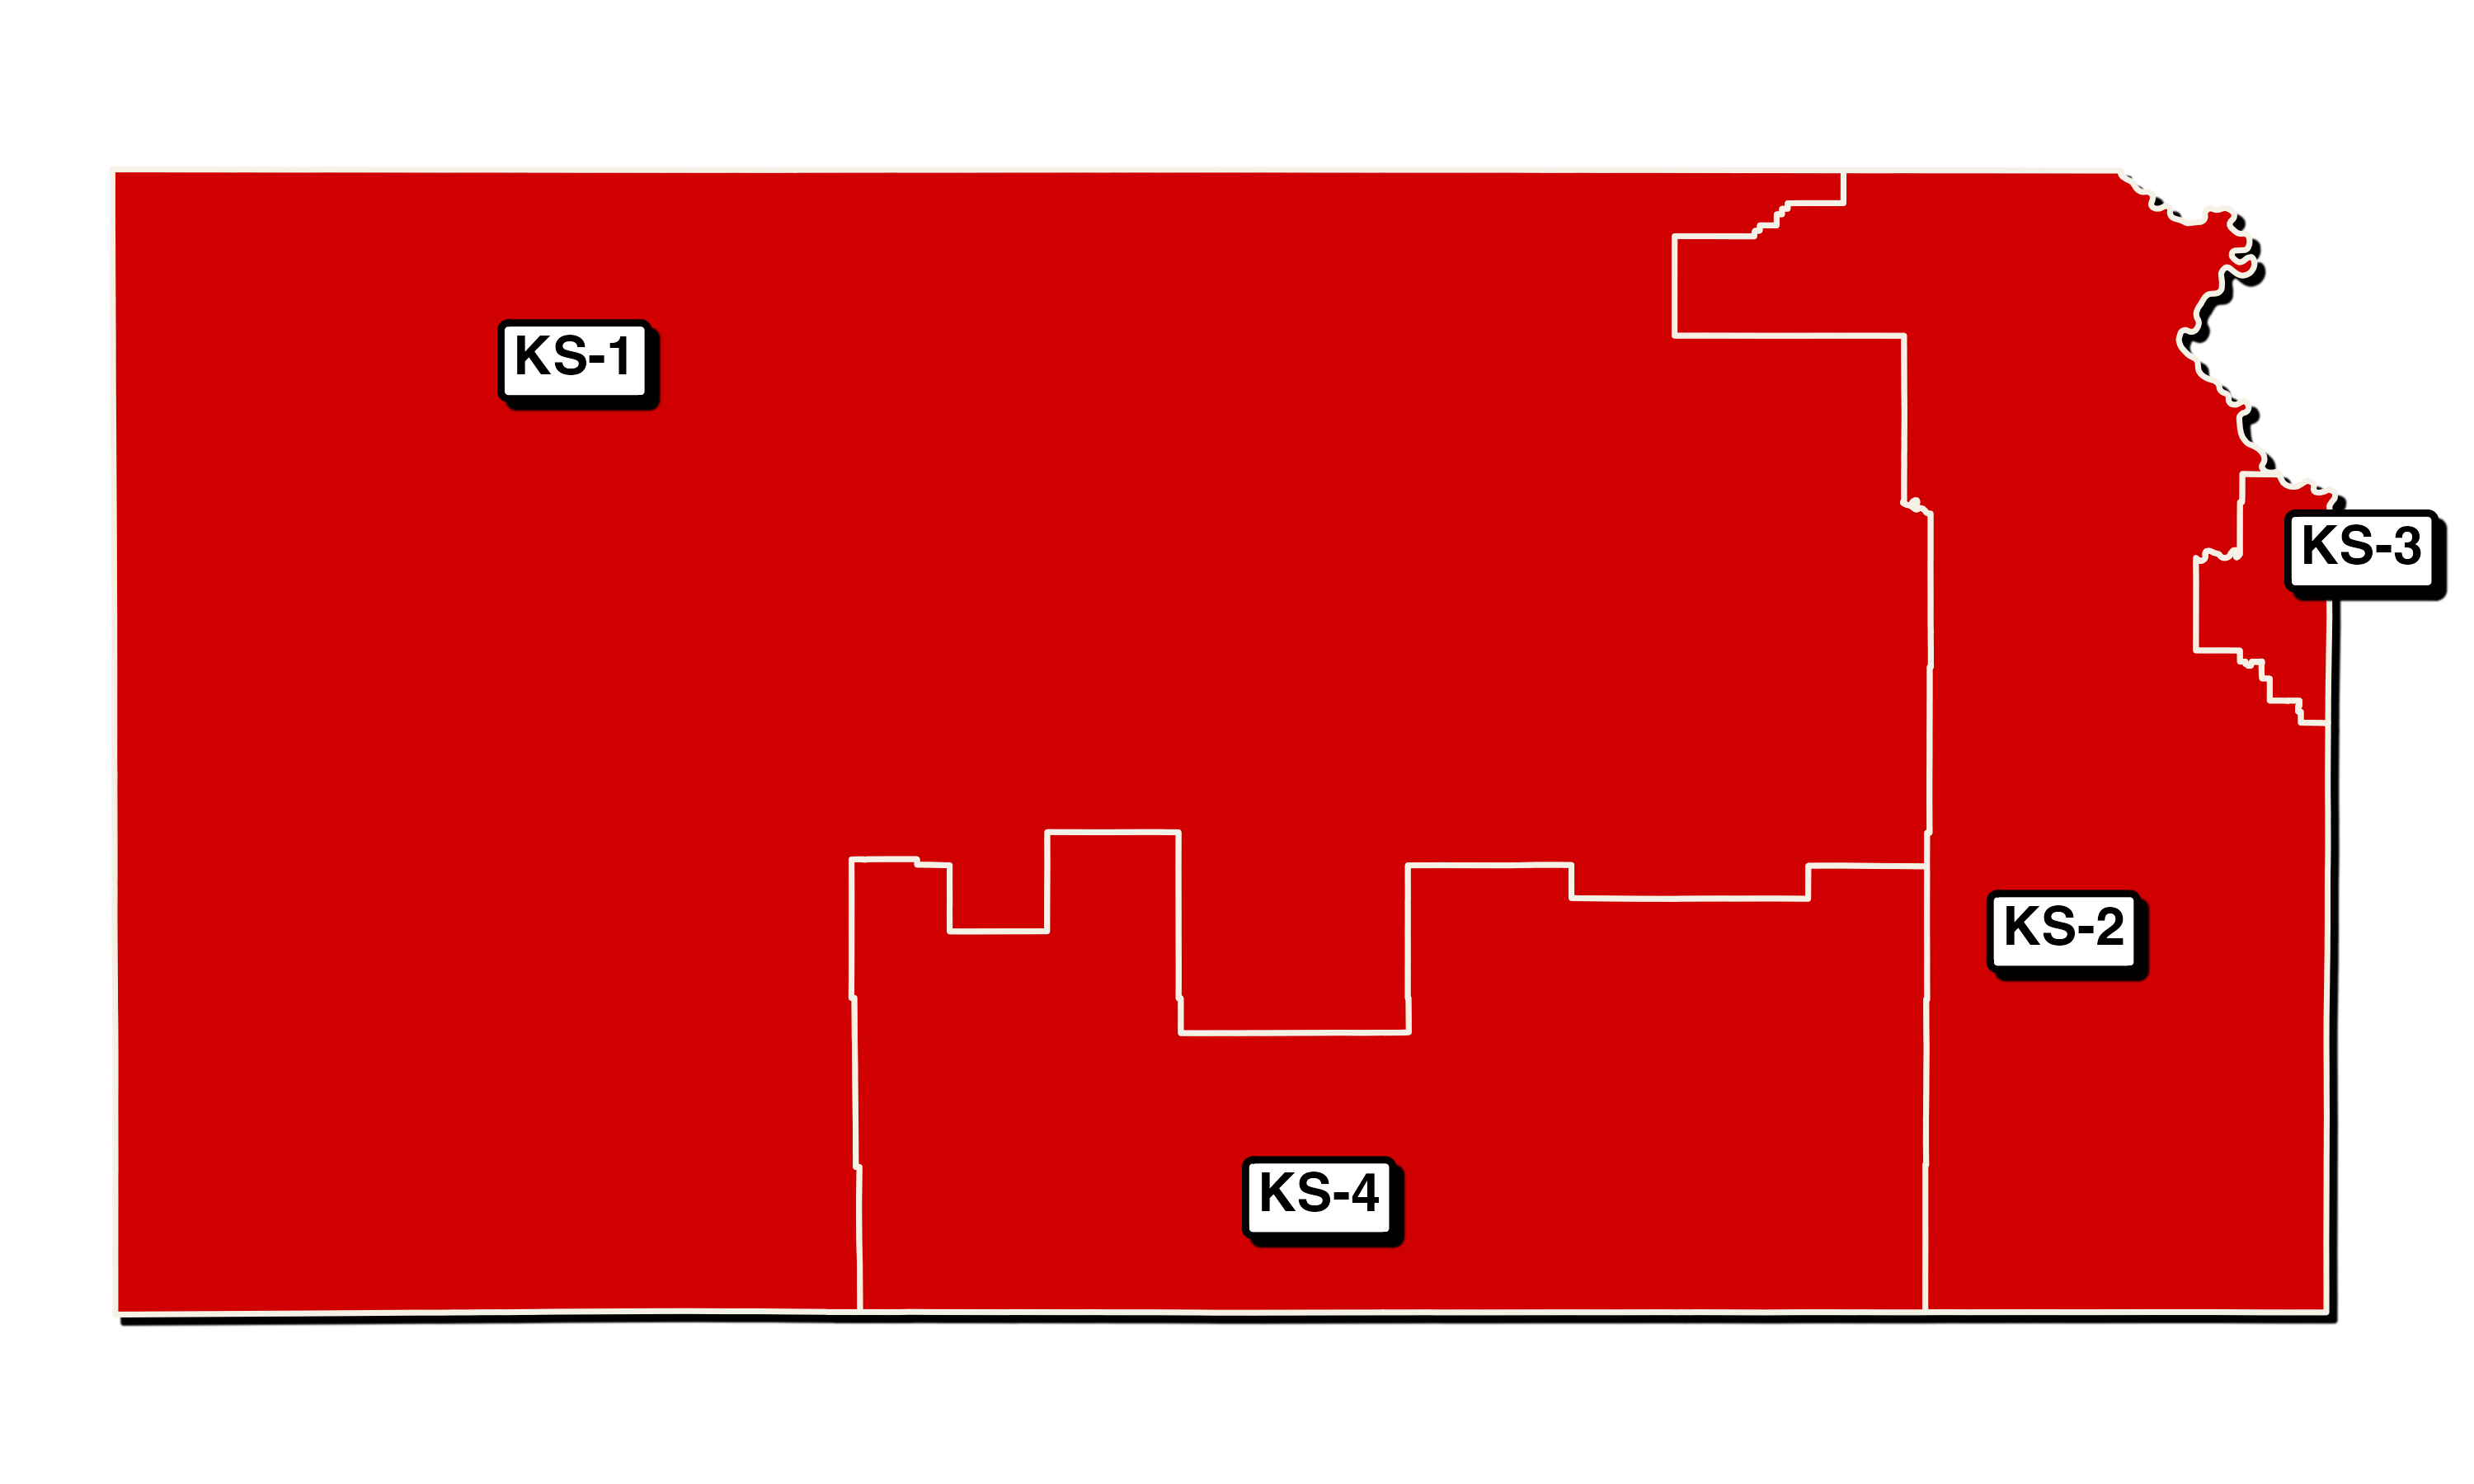
Look it’s Kansas!
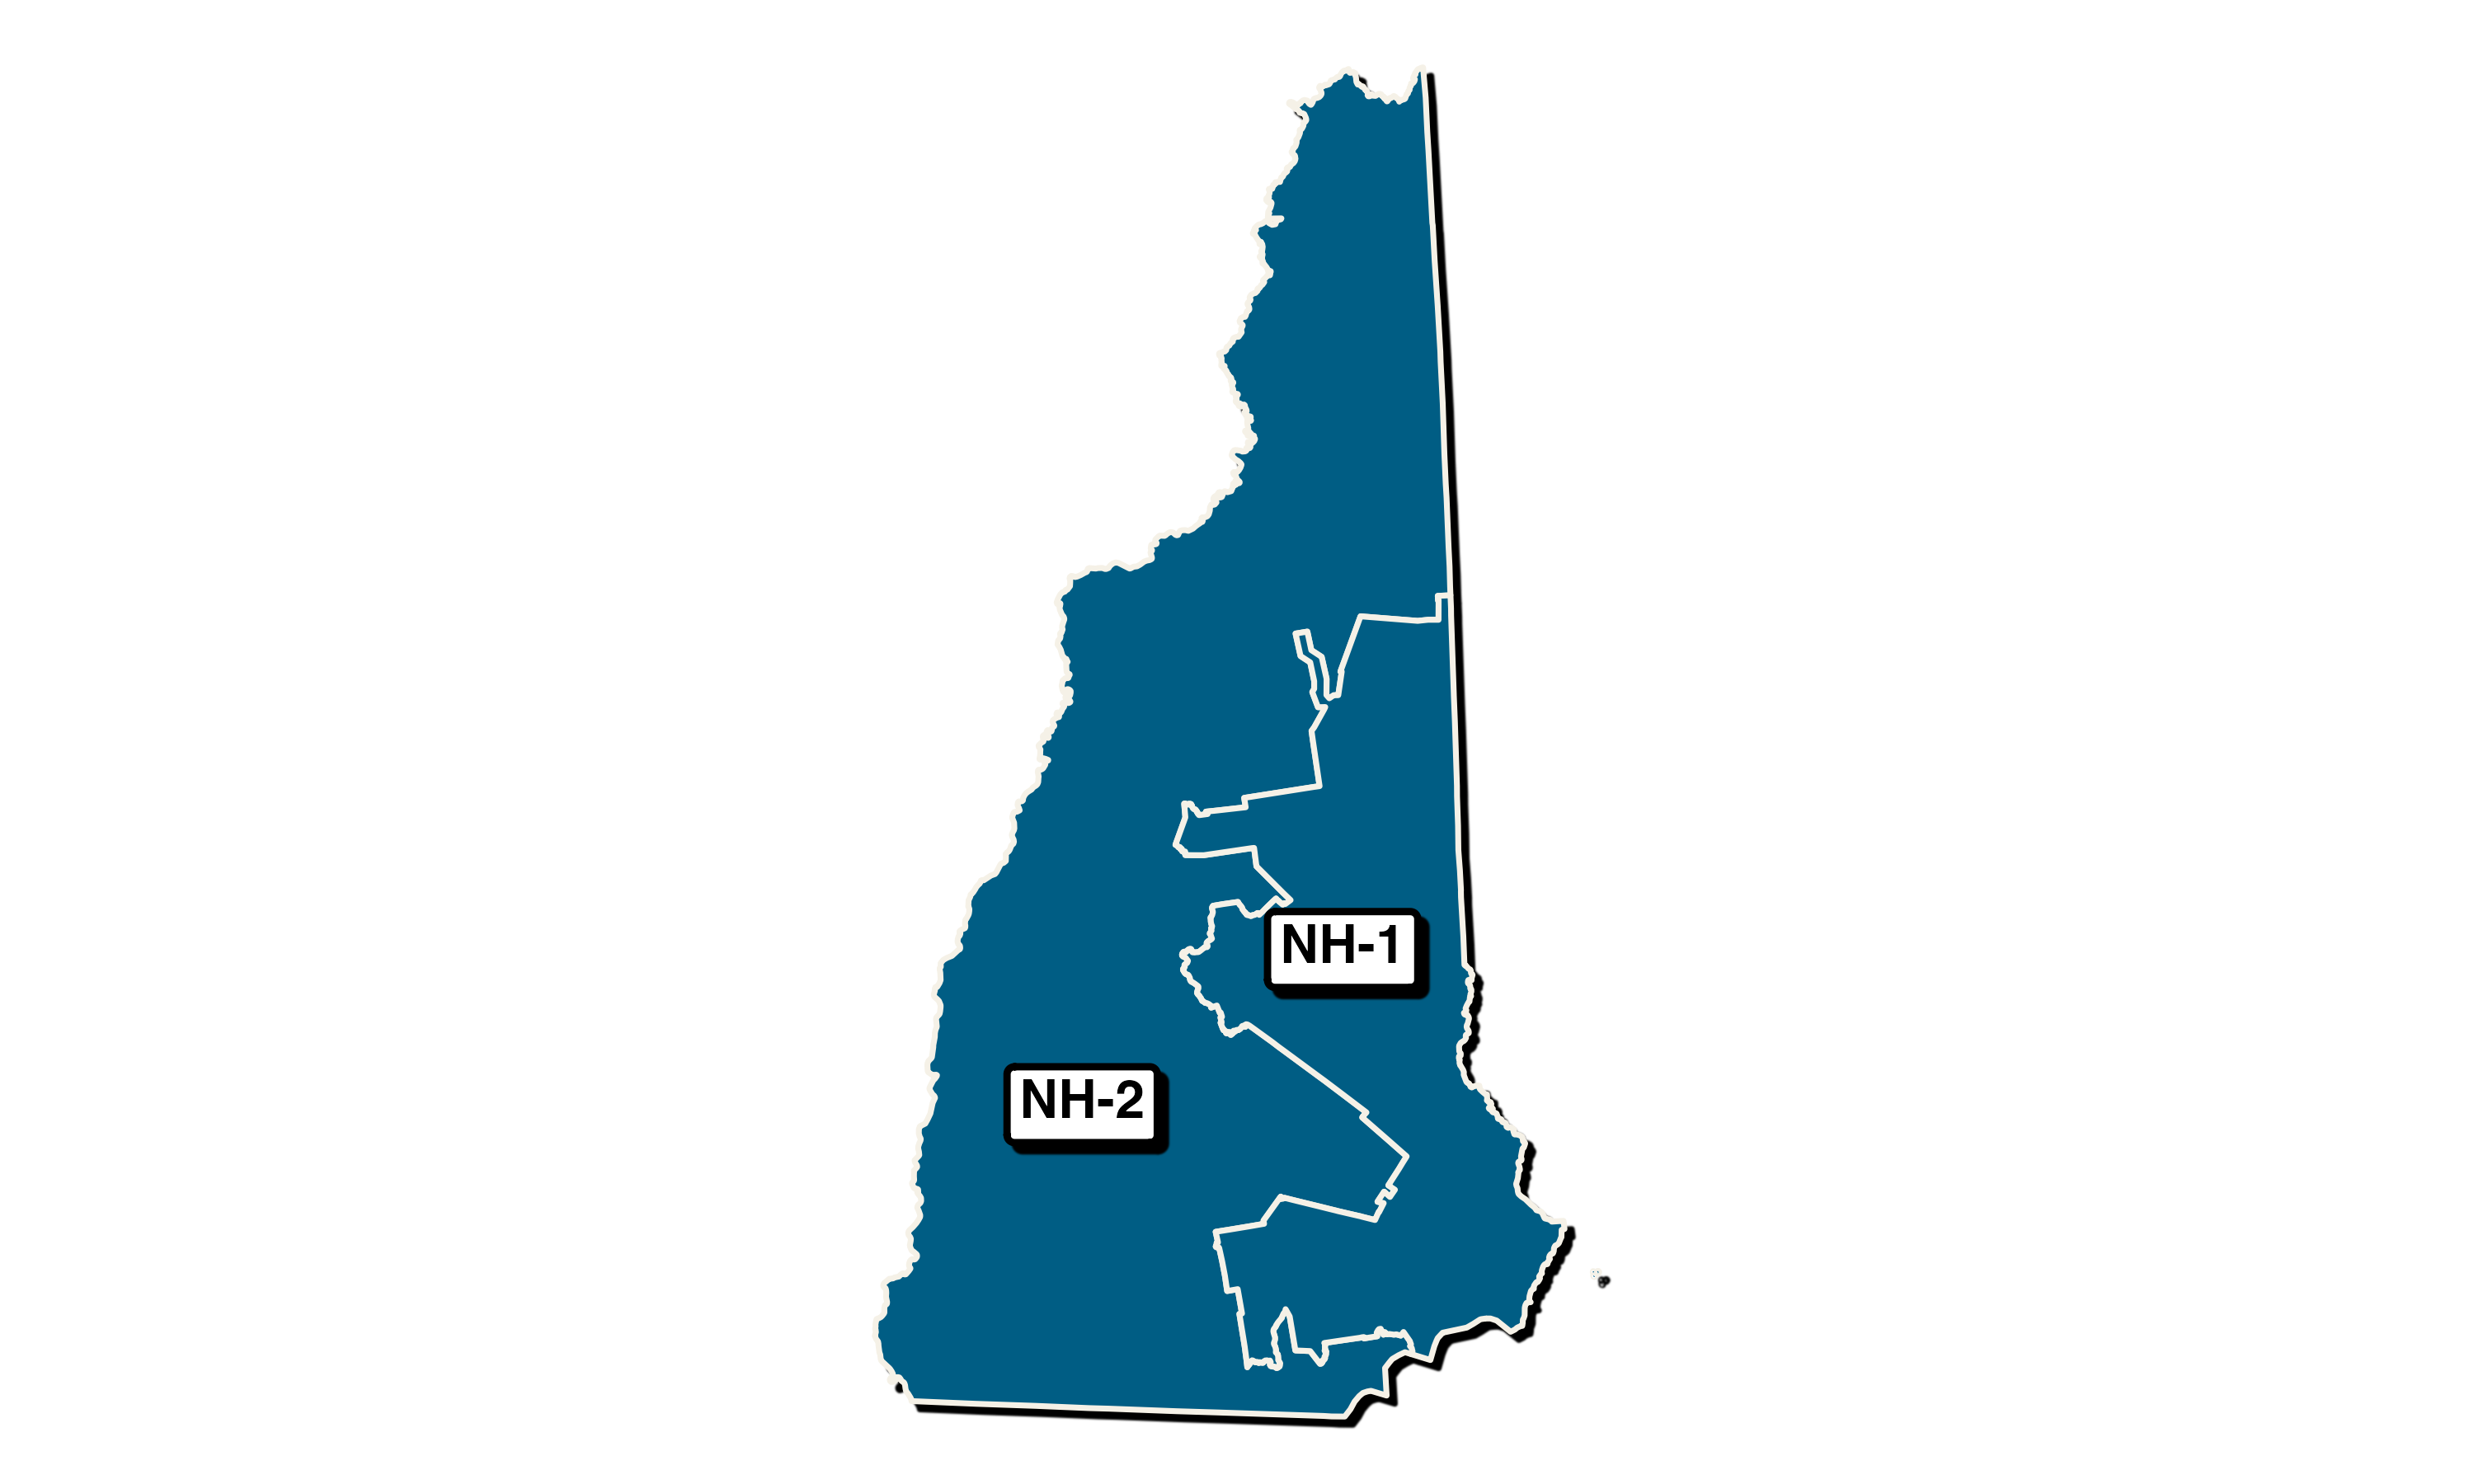
Also New Hampshire
Note
These maps all use the 2020 congressional district data